brendongray-portfolio
Part II
Wireframes
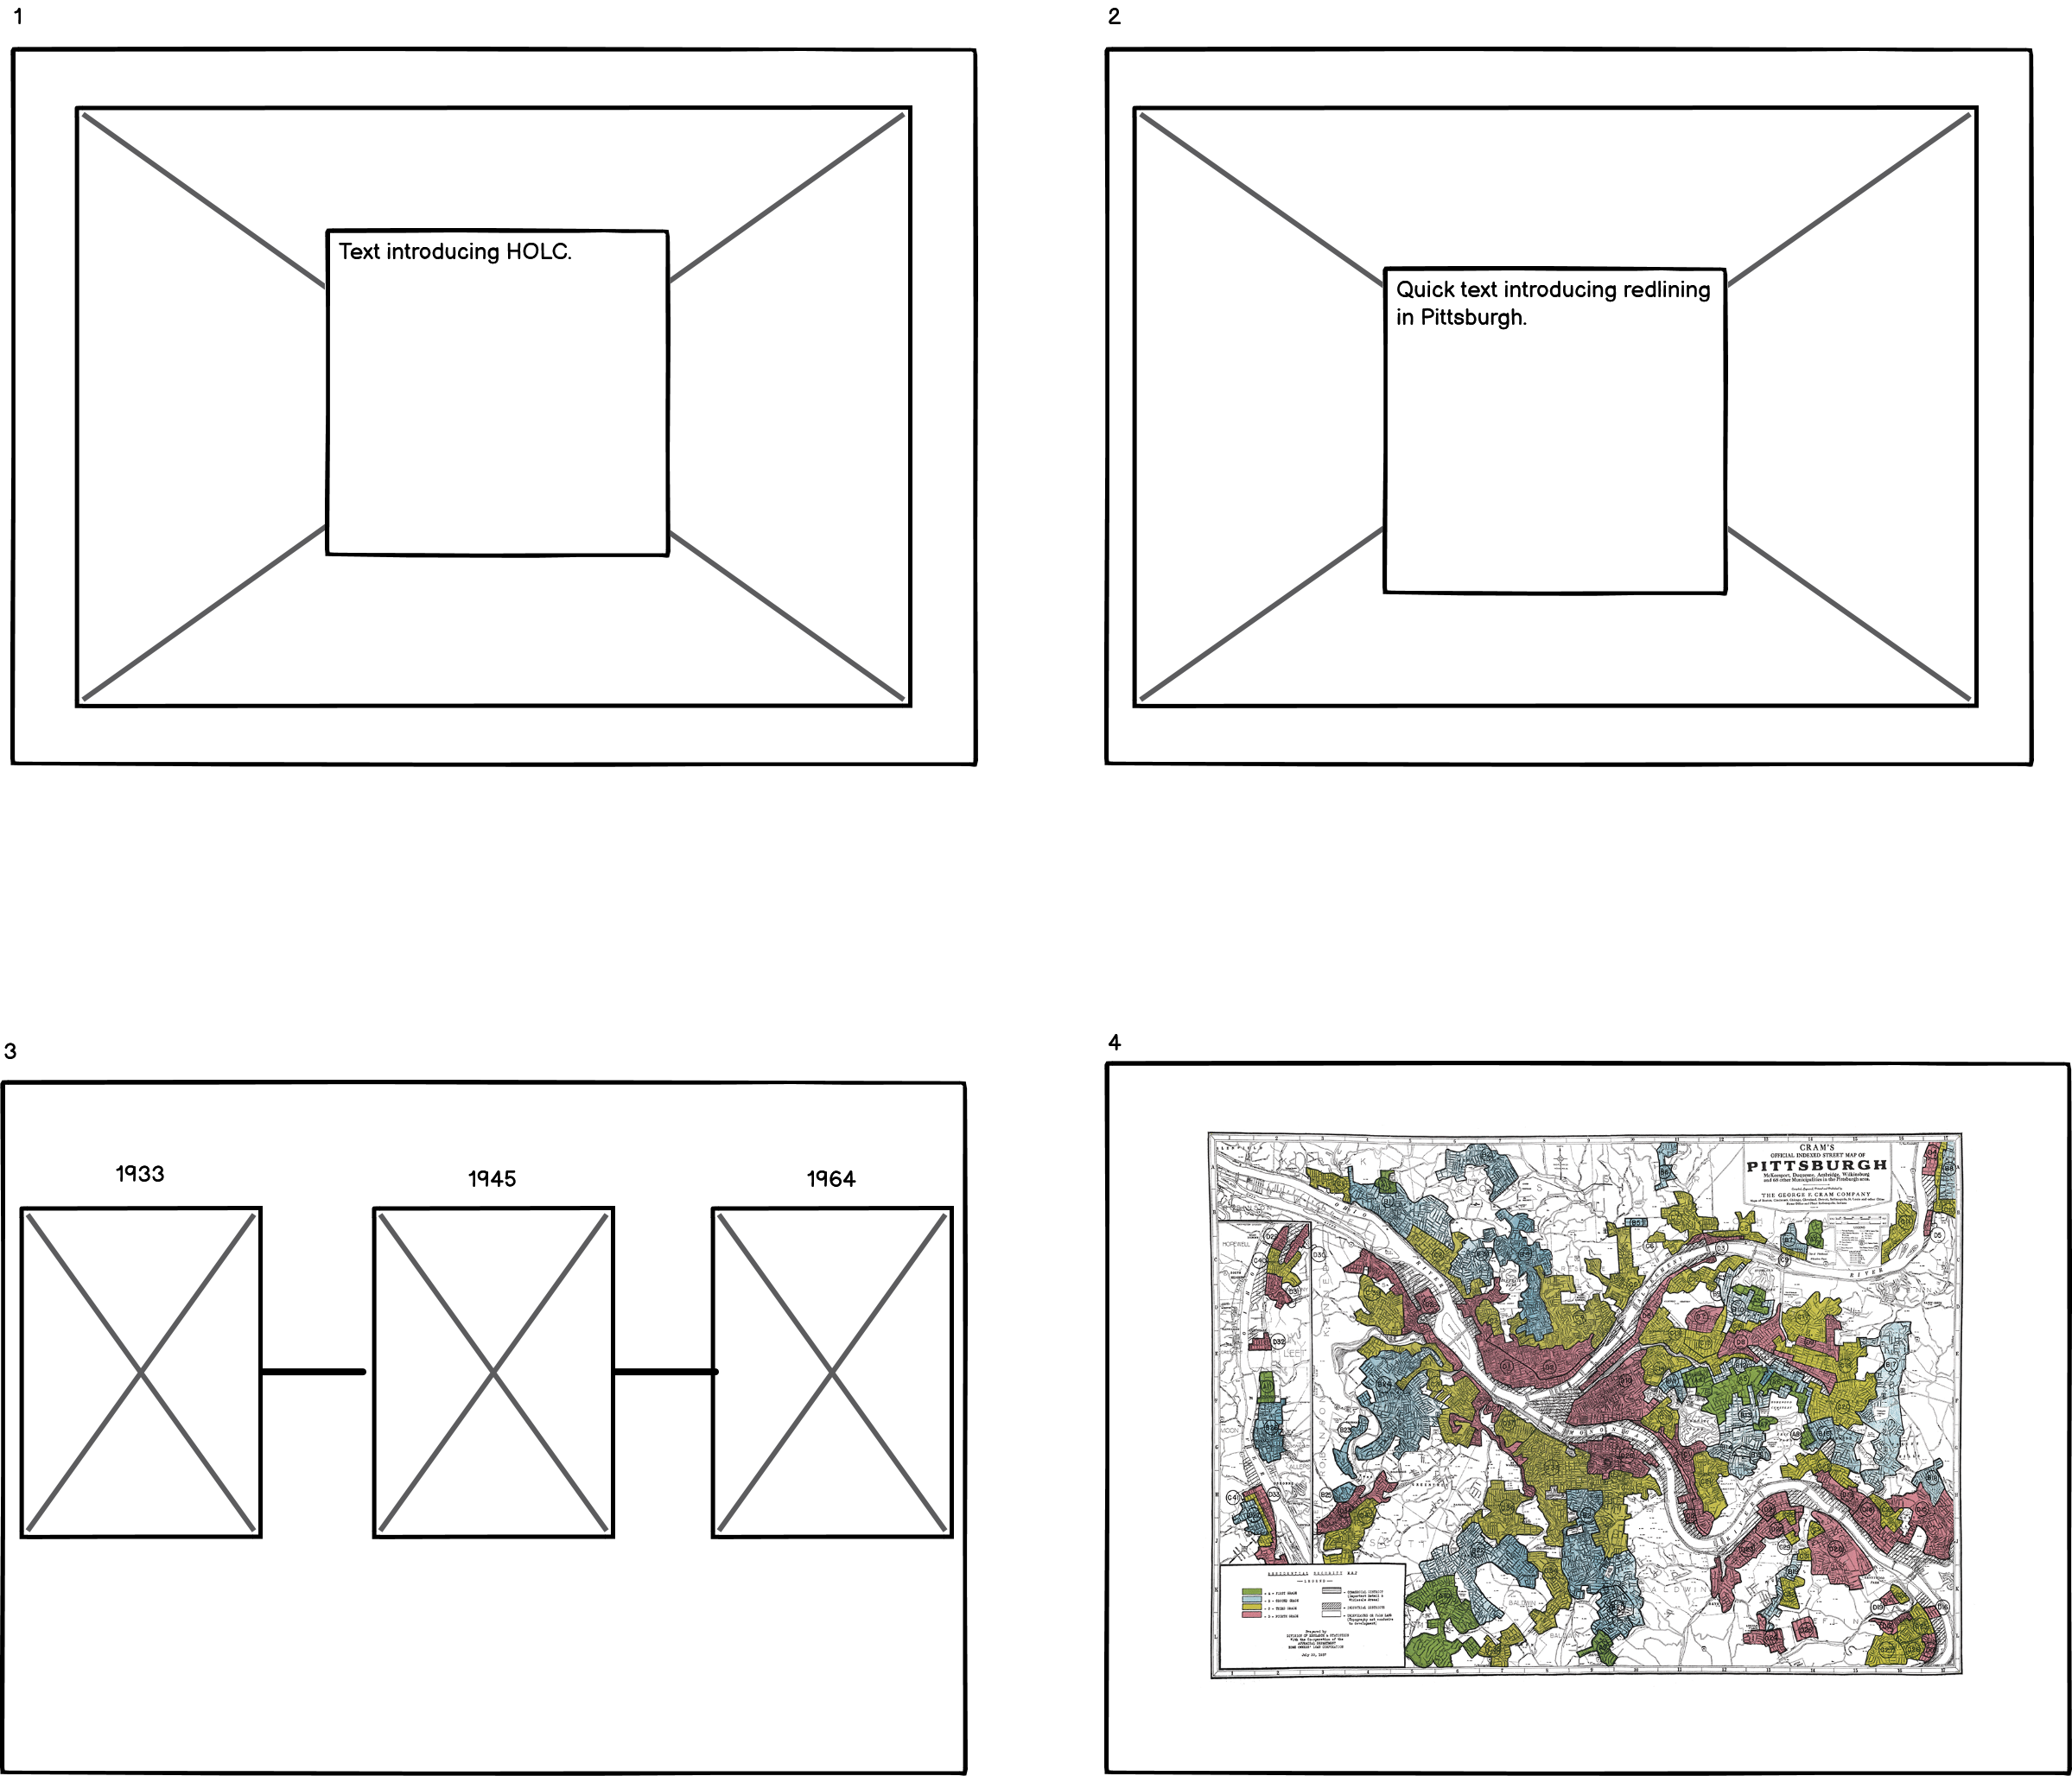
User Research Protocol
At this stage of the project, I developed a simple user research protocol that I used to interview 3 people about my draft visualizations.
Target audience and selection My target audience is people who work in policy or in policy-adjacent fields. The target audience has some knowledge of federal redlining, but does not work in housing, development, etc. Target audience members generally consider themselves liberal.
For my interview selection, I reached out to three individuals, described below. I have a good mix of professions, but I do not have a good mix of age or education level. Critically, none of the individuals were Black, which is a big preparation oversight. I’ll need to consider ways to clearly state (1) my lack of lived experience and (2) the limited scope of this presentation into racism in America generally.
Interviewee 1: Young engineer living in Pittsburgh. Interviewee 1 does not work in policy, but she has taken some courses in college and keeps up with the news.
Interviewee 2: A communications professional who works on political contracts. Interviewee 2 does not live in Pittsburgh. He has a political science degree.
Interviewee 3: An undergrad studying economics. Interviewee 3 lives in Pittsburgh. He is considering entering either politics or policy.
Having identified and scheduled interviews, I then prepared questions for the interviewees. I broke up my questions to be focused on the narrative and the visual elements of my wireframe. My initial idea was to ask each person verbatim the questions. In some instances, the comments came up naturally. For example, as I finished showing the presentation to interviewee 2, he said “the infographic resonated with me,” so I didn’t follow it up with my first prepared question.
Narrative-based Questions
| Question | Interviewee 1 Response | Interviewee 2 Response | Interviewee 3 Response |
|---|---|---|---|
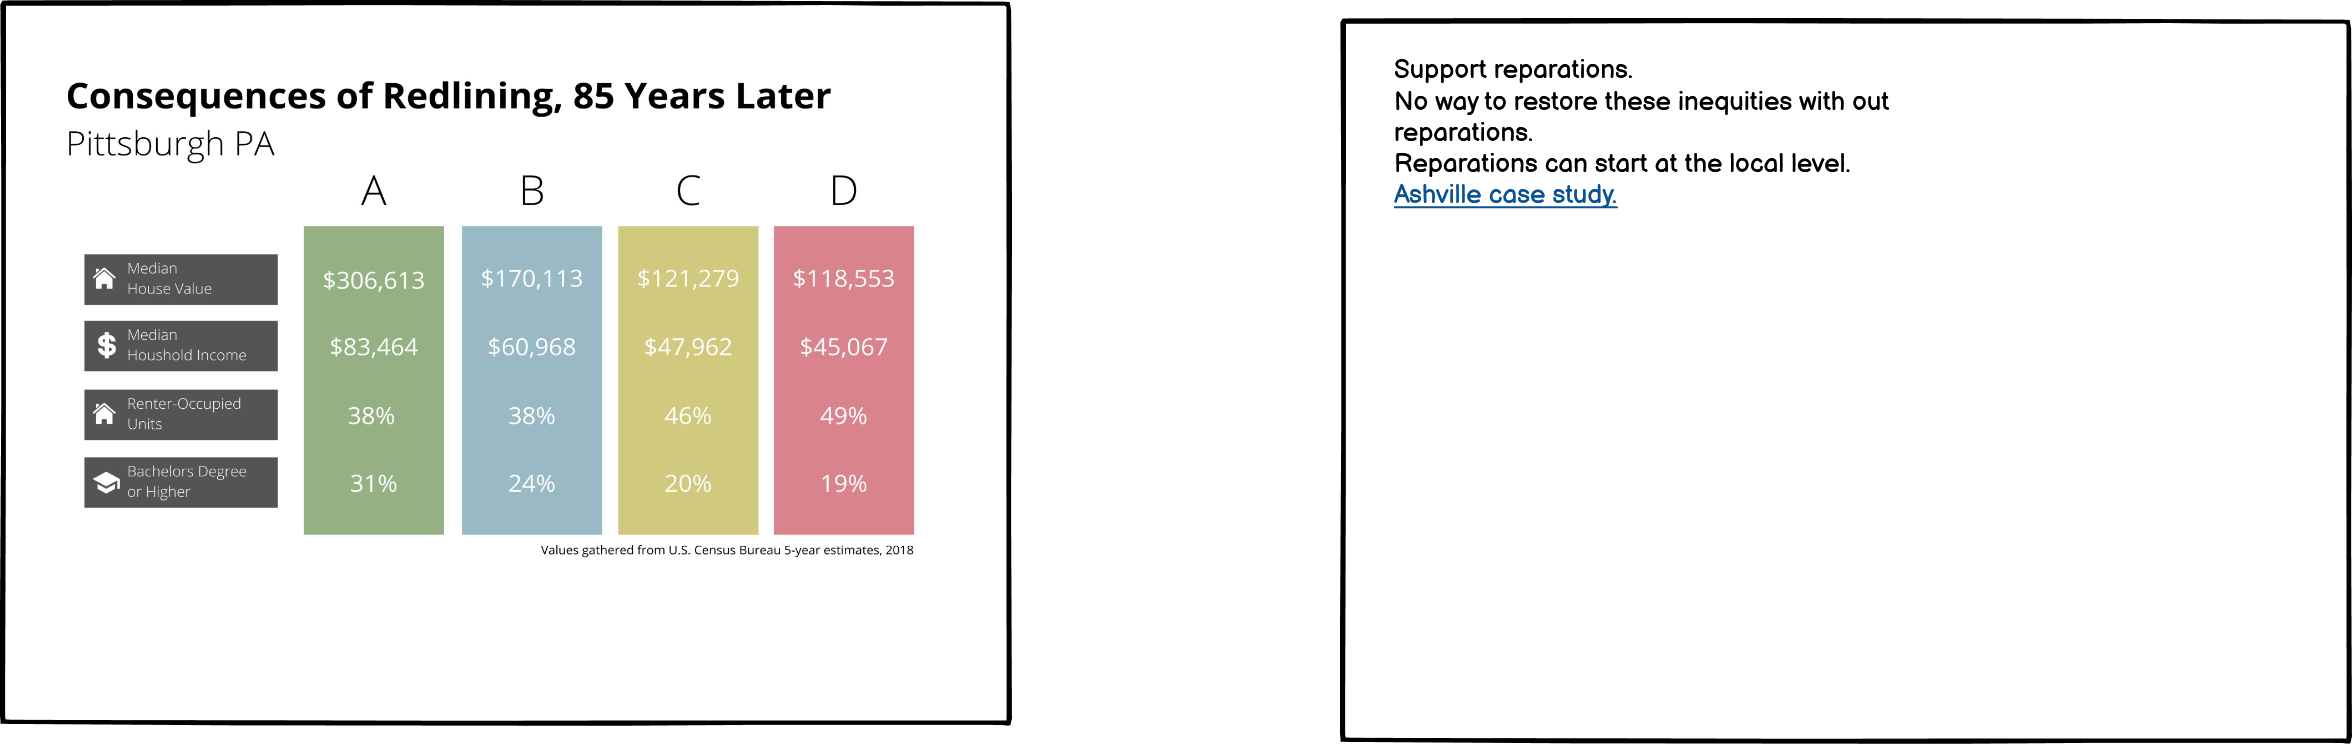
| “What is your main takeaway?” | “Redlining contributes to the race wealth gap.” Respondent highlighted that it happens in PGH. | Resonated with the infographic. | “Different distribution of sale price in different grades.” |
| “To what extent (if any) do you resonate with the call to action?” | “Understand how people were forced into lower value areas.” Unsure how this ties to other causes of ties to other elements of the racial wealth gap. | Consider adopting other measures: health, population, racial make-up. | Skeptical of the “causal direction.” |
Visual-based Questions
| Question | Interviewee 1 Response | Interviewee 2 Response | Interviewee 3 Response |
|---|---|---|---|
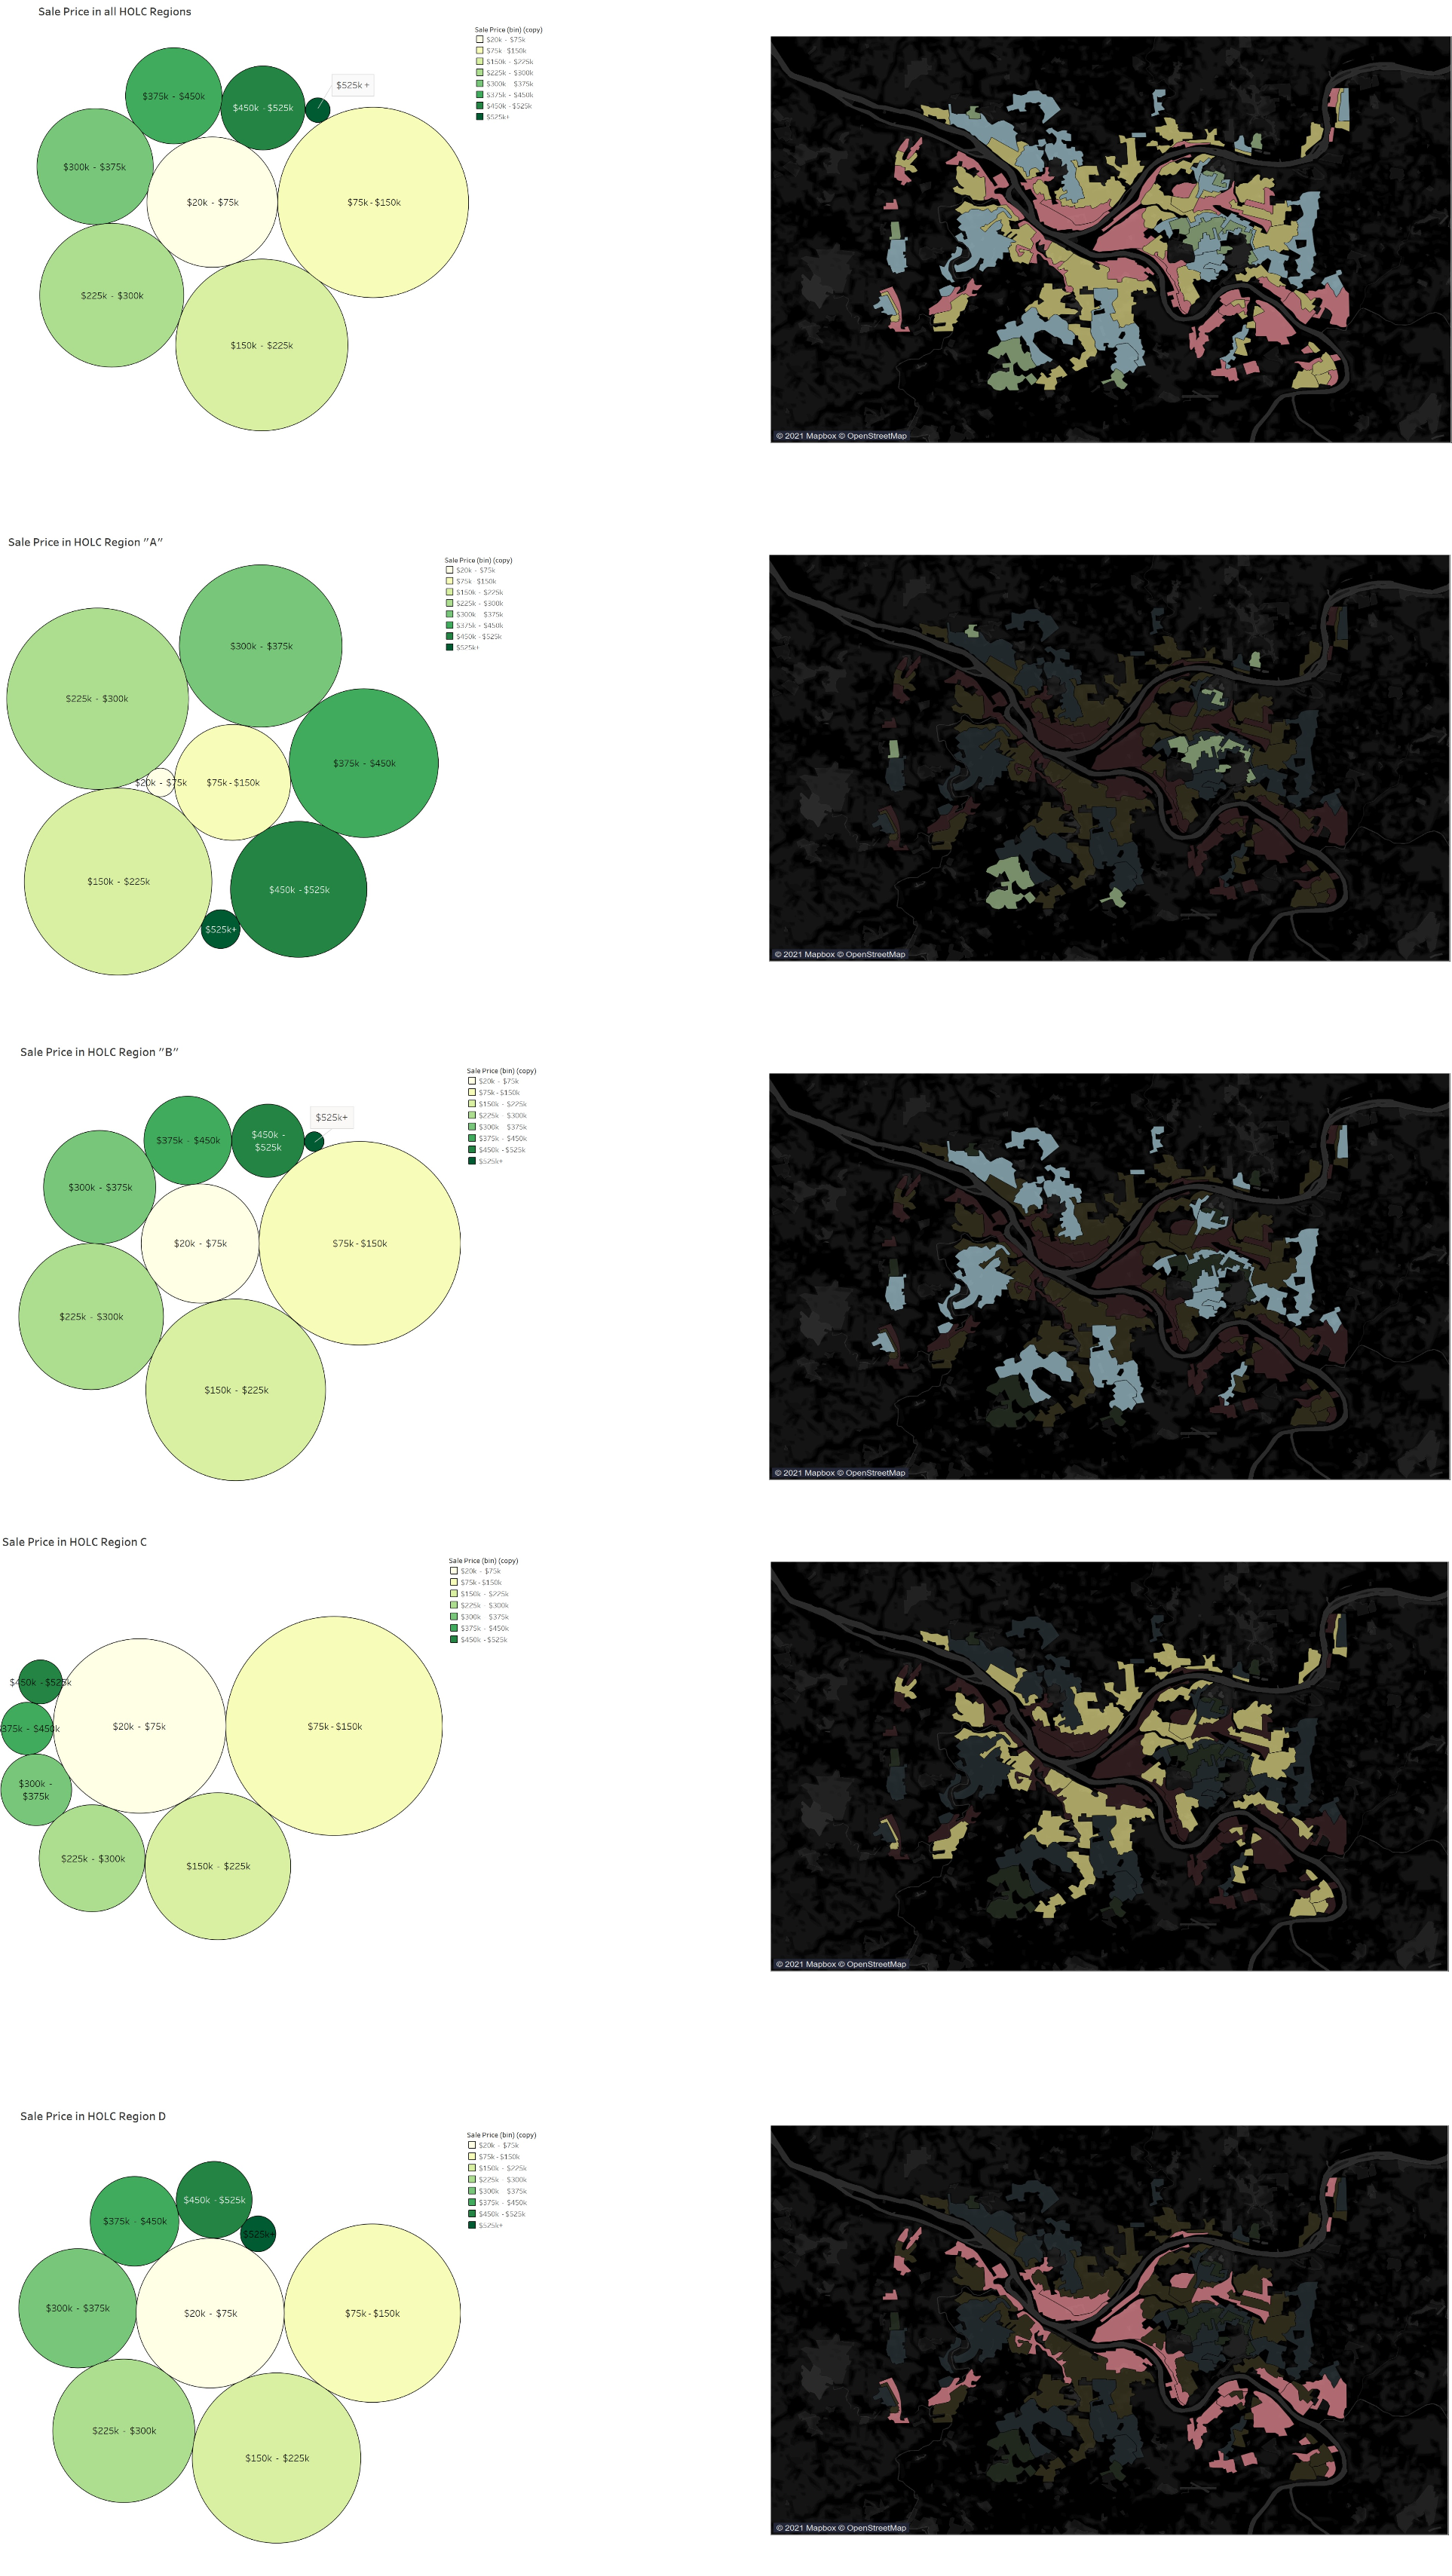
| “Can you describe your initial reaction(s) of the main graphic?” | Did not ask. | A little unclear (see below). | “Really good” if dots can change in real time with scroll. |
| “Was anything unclear about the graphics (all)?” | Consider adding more context before jumping in. | “The colors don’t correspond. As a viewer, I’m looking for colors to match [the bubble chart] to.” | None identified. |
| “What did you think of the overall aesthetic of the graphics?” | Recommended I consider tying bubble chart to the infographic color scheme. | “The legends could be clearer.” | “Clean.” |
Recommendations: Interviewee 1:
- “Situate [the bubble chart] in the overall presentation, then drill down into redlining.” (Interpreted to mean provide more context)
- “Focus on just one family example. Say ‘this family is owed X for housing discrimination,’ then elaborate that discrimination is much larger than housing.”
Interviewee 2:
- “Add more dimensions to the infographic. Health index, racial make-up, population trends.”
No overall recommendations from interviewee 3.
Themes: Aesthetically, the interviewees didn’t have many consistent comments. This is likely because I showed a relatively sparse wireframe with minimal non-data aesthetics. In terms of narrative, the biggest theme was understanding how redlining/disinvestment ties to other forms of racism. Both interviewee 1 and 3 hinted at this in their responses. I’ll use this insight to prioritize honing in the narrative that ties all the pieces together.
Changes I plan to make:
- Adjust color scheme per interviewee 2’s recommendation.
- Provide more context to the housing-redlining-systemic racism theme.
- Clarify call to action specifically around reparations. Build on large body of work.
- Consider narrative tools to support reparations call to action (i.e. one family example). (lowest priority)